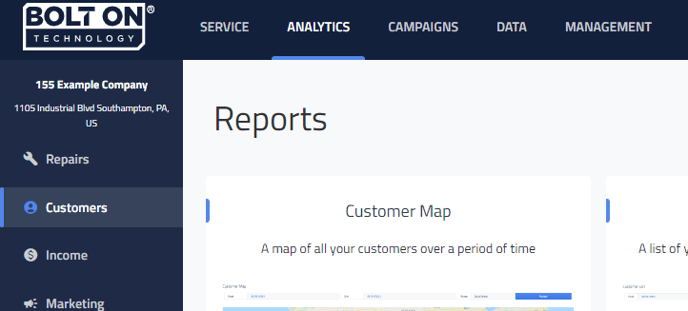
Customer Reports
Within Retention Pro we have multiple reports available to show customer behaviors and trends.
Please note you can click these links and they will take you directly to the report!

-
Customer Map - A map of all your customers over a period of time. This report has a customer key. All darts start Green, yellow means more than 3 visits or $1000 in spending, red means more than 8 visits or $5000 in spend. For more information see Customer Map Report
-
Best Customers - A list of your best customers sorted by income generated
-
New Customers - A list of your most recent new customers sorted by last visit date
-
Marketing Groups - A pair of pie charts that show your income and customer count broken down by behavioral categories.
-
Category Details - A collection of pie charts showing your customers grouped into behavioral categories, such as spending count, Last visit, total visit count, average spending per count, and visit frequency. For more information see Category Details Report
-
Customers by Source - Metrics to show Income, Count, and Average Ticket amount by Customer Source ( Only In certain Point of sales)
-
Unresponsive customers - A list of your customers that have not been responsive via text. These customers will be removed from the list once they text you back.
-
Invalid customers - A list of your customers that may have invalid data including emails, phones and addresses. This information can be updated in your Point of Sale and we will reflect that once it has been updated! For more information see Invalid Customers Report
-
Visits per vehicle - A report that displays vehicle visit frequency by customer
-
Retention Rates - A report to show customer retention and average transactions over a designated period of time
