Year Over Year Averages Report
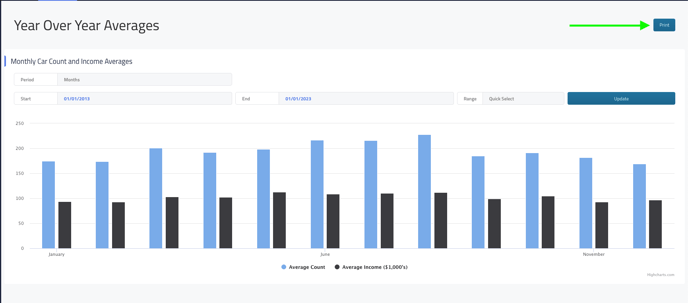
This bar graph report displays your monthly car count compared to your average income over a time period of your choosing. This data is pulled from your shop management system and then displayed accordingly.
Navigating to your year over year averages report
-
Login to your Retention Pro account.
-
Click [Analytics] at the top of your screen.
-
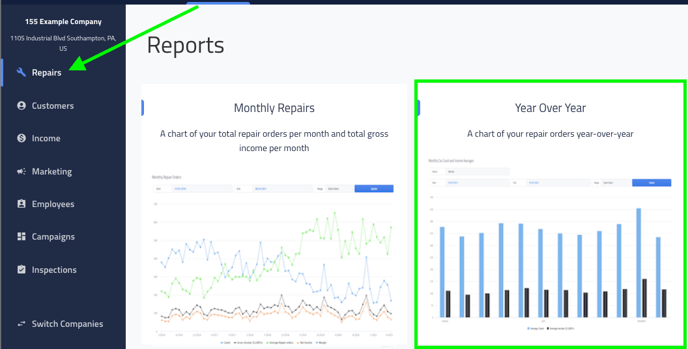
Click [Repairs] on your left navigation bar.
-
Click the report block named [Year Over Year].


Year Over Year Averages Date Range
When you load your report the date range will default to the last 10 years of data. The data is pulled from your shop management system and then displayed accordingly.
You can change the date range to whatever period you’d like by either updating the [Start/End Date] fields or using the [Quick Select Range], and then clicking update.


Printing the Year Over Year Averages Report
You have an option to print your report by clicking the [Print] button at the top right of your screen. The report will print based on the date range you have selected.


Reviewing report data
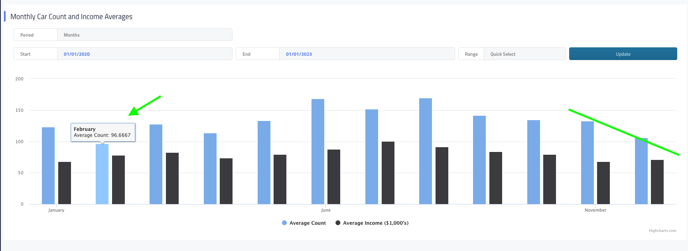
This report is an excellent tool in determining how your average car count (blue bar) fluctuates over the course of the year. Use this data to make educated decisions when preparing your direct mail strategy.
Lets use the graph below as an example. The date range has been changed to the last three years.
As you can see below, over the course of the last three years, average car count is the highest during the summer months and dips significantly going into the holiday season, with the lowest month being February.
Direct mail strategy recommendations
-
Before car count begins to dip schedule some direct mail campaigns to drive brand awareness and get customers coming back!
-
February is a great time of year to leverage the IRS mailer campaign to prevent a lag in car count and remind customers of their much needed repairs while they have some additional disposable income.


Other Repair Reports:
