
The Sentiment Analysis report in Retention Pro helps you understand how customers are responding to your campaigns at a broader level. While it doesn’t interpret each customer’s exact feelings, it scans their replies for key words and phrases to estimate overall sentiment and engagement. A response like "Great! I will come in tomorrow." would fall under Very Positive where as a response of "No, still having problems" would be placed under Negative.
Navigating to the report
-
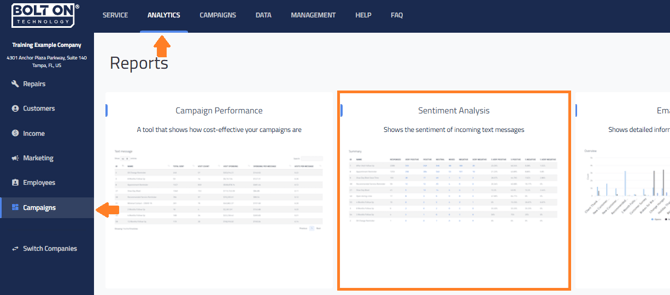
Login to your Retention Pro account.
-
Click Analytics at the top of your screen.
-
Select Campaigns from the left side menu.
-
Click the report named Sentiment Analysis.

Changing the Date Range
When you open the Sentiment Analysis report the date range will default to the last year of data available. You can change the date range to whatever period you’d like by updating the Start Date and End Date fields or you can use the Range Quick Select option (for pre-set options like Last Week and Last Month). Click the Update button to load the data you have selected.


Reviewing report data
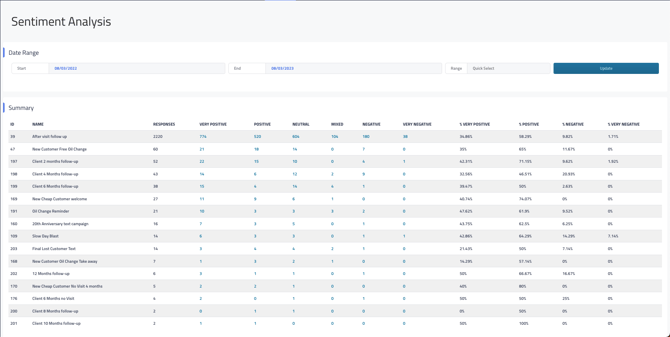
When customers text back in response to your campaigns, Retention Pro uses AI to scan the words and phrases in each reply and assess the overall sentiment. That information is then summarized and displayed in the following columns on the report:
-
ID: This is the unique identifier for your campaign. Unlike the campaign’s name it can never change.
-
Name: The name of your text campaign.
-
Responses: The number of texts you received back from the campaign. These responses are then broken down into the following sentiment columns; Very Positive, Positive, Neutral, Mixed, Negative, and Very Negative.
-
% Very Positive: Percentage of total responses that were very positive.
-
% Positive: Percentage of total responses that were positive.
-
% Neutral: Percentage of total responses that were neutral.
-
% Mixed: Percentage of total responses that were mixed.
-
% Negative: Percentage of total responses that were negative.
-
% Very Negative: Percentage of total responses that were very negative.

Reviewing messages in each sentiment segment
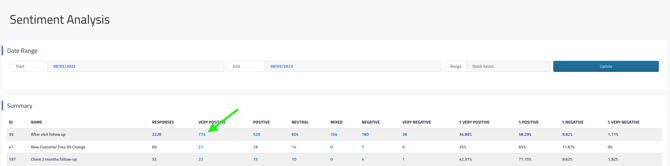
If you click the blue hyper link under each sentiment column two tables will load at the bottom of the page.

Example
-
Campaign: After Visit Follow Up
-
Sentiment: Very Positive
Table One: Outgoing Message
-
The campaign message that was sent to your customers.


Table Two: Incoming Message
-
Lists every message you received in response to your campaign.
-
Date: The date and time you received the message.
-
Customer: The name of the customer that sent you the message. Clicking their name will navigate you to their customer profile.
-
Incoming Message: The full message your customer sent you.
-
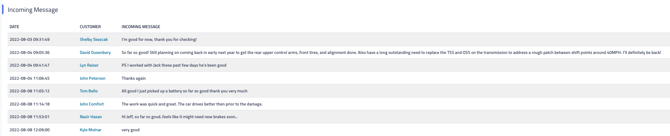

You may notice in the customer responses that not all of them may fit into the sentiment they have been sorted into, this is normal since the system that sorts responses is not fool proof. For example; a customer may reply "No thank you" to Slow Day Blast and that could be sorted into the Mixed or Negative sentiment because it contains the word "No" even though it is not necessarily a Negative reaction.