Monthly Repairs Report
This report displays how your average repair orders, car count, and income trend over time. This data is pulled from your shop management system and then displayed accordingly.
- Navigating to your monthly repairs report
- Monthly Repairs Date Range
- Printing the Monthly Repairs Report
- Reviewing totals breakdown
- Hiding trend lines from your graph
Navigating to your monthly repairs report
-
Login to your Retention Pro account.
-
Click [Analytics] at the top of your screen.
-
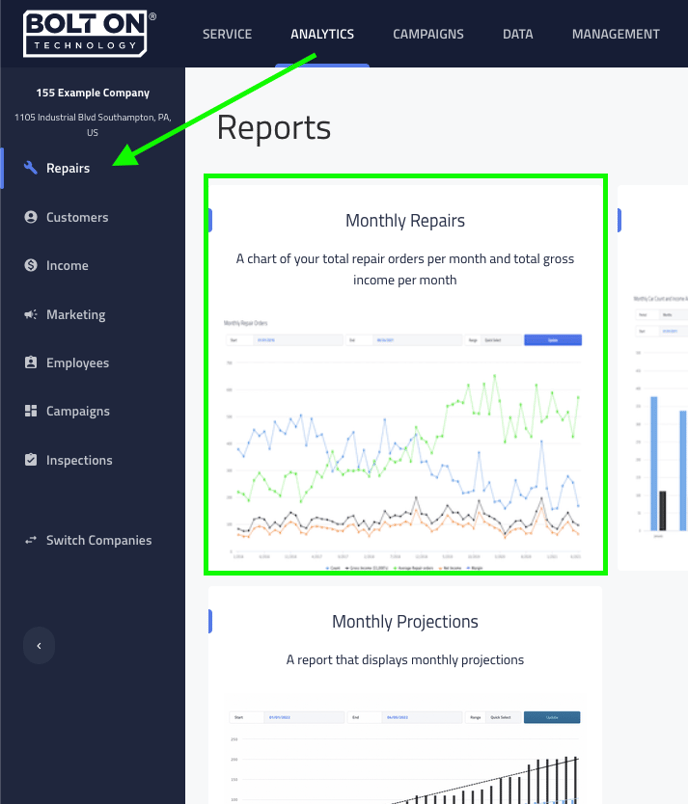
Click [Repairs] on your left navigation bar.
-
Click the report block named [Monthly Repairs].


Monthly Repairs Date Range
When you load your report the date range will default to the last 5 years of data. The data is pulled from your shop management system and then displayed accordingly.
You can change the date range to whatever period you’d like by either updating the [Start/End Date] fields or using the [Quick Select Range], and then clicking update.


Printing the Monthly Repairs Report
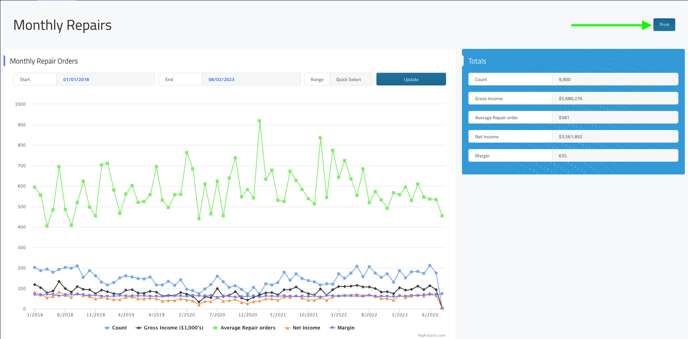
You have an option to print your report by clicking the [Print] button at the top right of your screen. The report will print based on the date range you have selected.


Reviewing totals breakdown
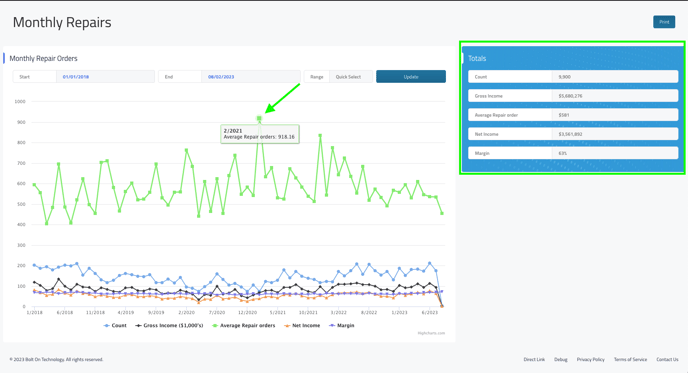
The monthly repairs report is a line graph that visually displays your data. You can hover over each line segment to get a quick snapshot of your data for the point you selected.
A complete breakdown of your totals, for the time period you selected, is available at the top right of your report.


Hiding trend lines from your graph
The following trend lines are visible on your graph by default.
-
Count (Car count)
-
Gross Income
-
Average Repair Order (ARO)
-
New Income
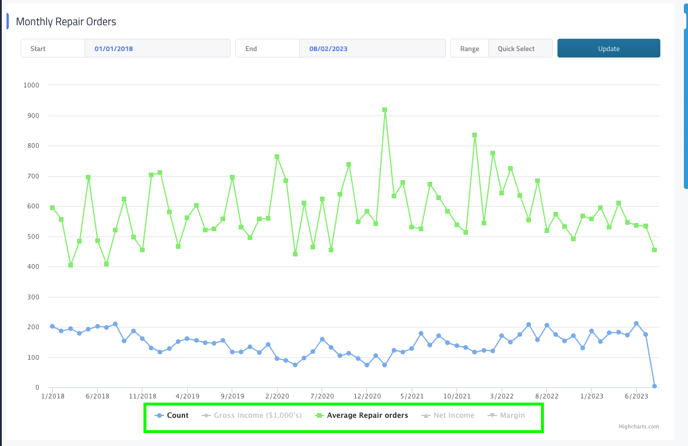
You can use the legend at the bottom of your graph to hide trend lines you don’t wish to see. In the example below only car count and ARO are selected, so we can see how they trend together over time.


Other Repair Reports:
