Direct Mail Campaign Tracking
Tracking for Direct Mail campaigns can give you an idea of how that campaign performed.
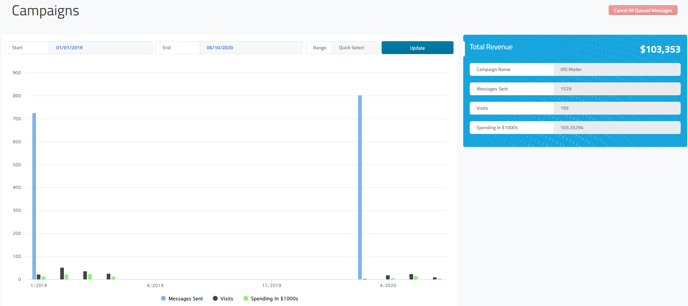
Next to each campaign in the Campaigns section is an Edit button and a Track button. If you click Track it will open a page with a graph that shows basic tracking and performance for that campaign.

We track the customer that was sent that campaign for 90 days from when the mail was sent. This is designed to provide a general idea of the campaign's performance.
When the tracking page is open it will show you a graph with multiple bars.
At the top you will have a date range that you can customize, you can also use the quick selector to pick this month, last month and year to date.
On the side you can see total revenue, how many messages were sent in total, Total Spending and Visits from the date selected.

 The bars on the graph are color-coded for clarity:
⚫Black indicates the number of visits
💲Green reflects spending in increments of $1,000.
For more on Direct Mail please see What is direct mail?
