Customer Map Report
Under Analytics you can click on the option for Customers to access the Customer Map.

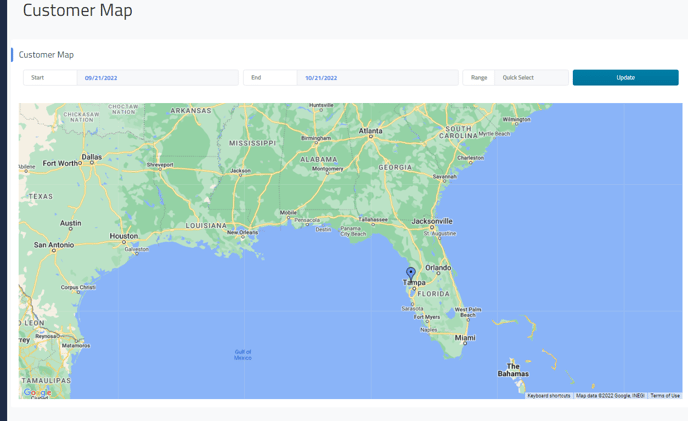
The Customer Map report will open a moveable map from Google Maps.
There will be a 🔵blue dart on the map for the location of your shop.
If you want to view only customers that have visited within a specific date range you can use the "Start" and "End" options at the top to set that date range.

You can click and drag to “move” the map or you can press the “Ctrl” button on your keyboard while using the scroll wheel on your mouse to zoom in/out.

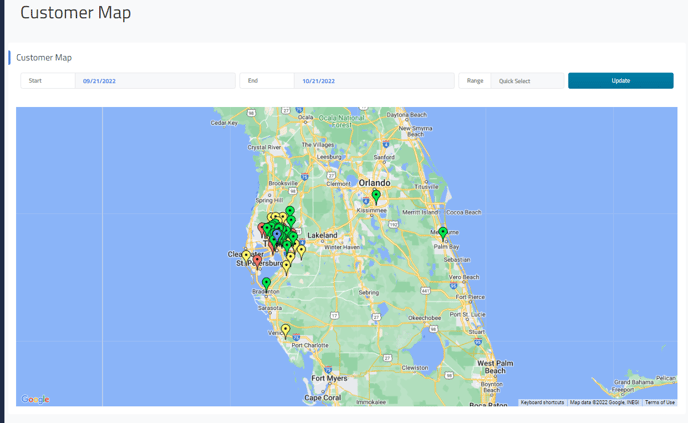
This map shows the locations of all of your customers over a period of time using darts.
The different colors of the darts represent the categorization of your customers based on their visit frequency and spending levels.
All darts start Green - these will be customers who have only visited once or twice, or have spent less than $1,000.
Yellow darts - More than 3 visits or $1,000 in spending.
Red darts - More than 8 visits or $5,000 in spending.
You can click on the darts to see which customer they represent as well as the number of times they’ve visited and their total spending.
Return to the main article Customer Reports
