Category Details Report
This report is a collection of pie charts showing your customers grouped into behavior categories. You can use it to identify the relationship between your customer’s visit frequency and spending averages.
- Navigating to your category details report
- Customer Details Date Range
- Printing the Category Details Report
- Reviewing customers in each segment
- Average Spending Section Overview
- Last Visit Section Overview
- Total Visit Section Overview
- Average Spending Per Count Section Overview
- Customer Visit Frequency Section Overview
Navigating to your category details report
-
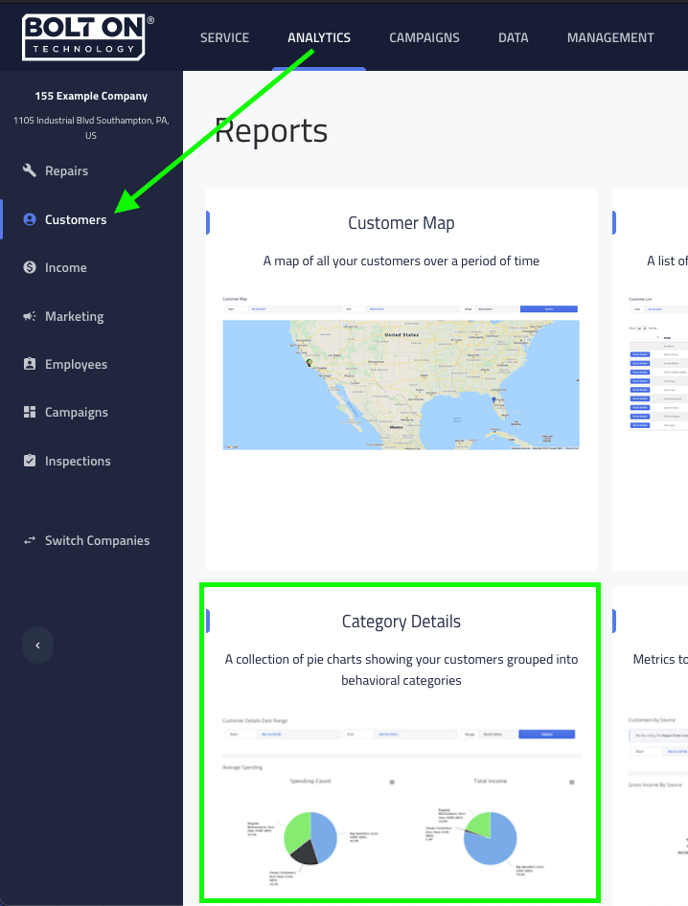
Login to your Retention Pro account.
-
Click [Analytics] at the top of your screen.
-
Click [Customers] on your left navigation bar.
-
Click the report block named [Category Details].


Customer Details Date Range
When you load your report the date range will default to the last 3 years of data. The data is pulled from your shop management system and then displayed on each pie graph accordingly.
You can change the date range to whatever period you’d like by either updating the [Start/End Date] fields or using the [Quick Select Range], and then clicking update.


Printing the Category Details Report
You have an option to print your category details report in its entirety by clicking the [Print] button at the top right of your screen. The report will print based on the date range you have selected.


If you would like to download an image of a specific pie graph within your category details report you can do so by clicking the stacked line icon at the top of each individual graph.


Reviewing customers in each segment
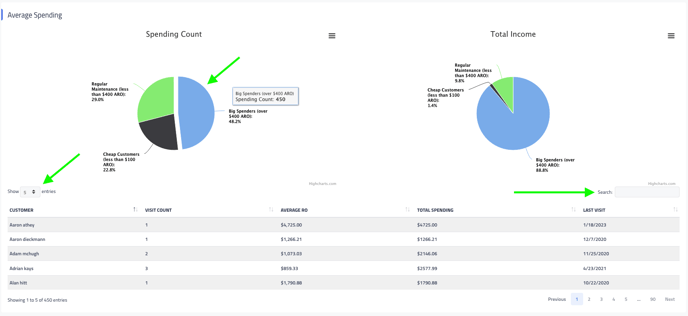
While reviewing your report, you can choose a segment within each pie graph. By selecting a segment, you will see a list of all customers belonging to that segment during the specified time period. This data is extracted from your shop management system and includes:
-
Customer' Name
-
Visit Count
-
Average Repair Order (RO)
-
Total Spending
-
Last Visit
The list will default to 5 entries and can be increased to view up to 50 entries at a time. You also have the ability to search customer names to find specific information you are looking for.


Average Spending Section Overview
The average spending section breaks down your customers into three groups.
-
Cheap Customers: Customers whose average repair order is less than $100.
-
Regular Maintenance: Customers whose average repair order is less than $400.
-
Big Spenders: Customers whose average repair order is over $400.
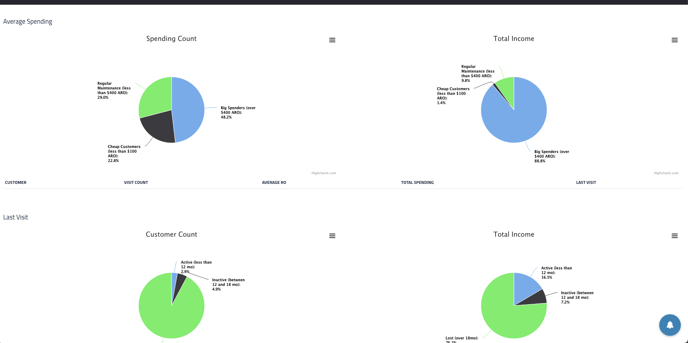
From the report below you can see that, over the last three year period, the Big Spenders segment represents 48.2% of total customer spending but contributes to 88.8% of total income over the same period.
With this information at your disposal you can create specific campaigns or adjust average repair order filters, within existing campaign, to target this customer segment effectively.


Last Visit Section Overview
The last visit section breaks down your customers into three groups.
-
Active: Customers who visited within the last 12 months.
-
Inactive: Customers who visited between the last 12-18 month.
-
Lost: Customers who haven’t visited in over 18 months.
This report stresses the importance of retention campaigns (2,4,6,8,10 month follow up automation) to prevent your customers from becoming “lost”.
From the report below you can see, that over a three year period, the lost customer group segment represents 92.2% of the customer count and 76.2% of total income.
If safeguards are not put in place to ensure these “lost” customers keep coming back then it has a direct negative effect on your bottom line.


Total Visit Section Overview
The total visit count section breaks down your customers into four groups.
-
New Customers: Less than 3 visits.
-
Customer: Between 3-5 visits.
-
Client: Between 6-9 visits.
-
Regular: 10 or more visits.
This is an important report because it helps to stress the importance of creating a regular customer base. In general it is much more expensive to acquire new customers then retain existing ones.
With that being said, if you find yourself depending on new customers to contribute to a significant part of your income we recommend the following:
-
Use after visit thank you and new customer welcome campaigns to nurture relationships with your customers.
-
Use service reminders campaigns like oil change reminders to show your customers you care about the health of their vehicle.
-
Use follow up campaigns to create healthy dialogue with your customer throughout the year so they think of you when its time for needed service.
-
Use reputation manager campaigns to gain valuable feedback from your customers and promote your brand on Google thru positive reviews.


Average Spending Per Count Section Overview
The average spending per count section breaks down your customers into four groups.
-
New Customers: Less than 3 visits.
-
Customer: Between 3-5 visits.
-
Client: Between 6-9 visits.
-
Regular: 10 or more visits.
This report is very similar to the total visit section report but instead of comparing the above segments to your total income they are compared to their average repair order data.


Customer Visit Frequency Section Overview
The customer visit frequency section breaks down your customers into three groups.
-
Single: Customers who visited 1 time.
-
Occasional: Customers who visited less then 2 times.
-
Frequent: Customers who visited 2+ times.
This report also stresses the importance of retention campaigns (2,4,6,8,10 month follow up automation).
If you look at the report below you can see that single (one time customers) contribute to 65.5% of total visits but only 42.1% of total income over the same period. Whereas frequent customers sitting at 33.2% of total visits contribute to 56.5% of total income over the same period.
The goal of your marketing efforts should be focused on ensuring that more of your one time visitors become frequent customers which should inevitably contribute to an increase in your income over time.


